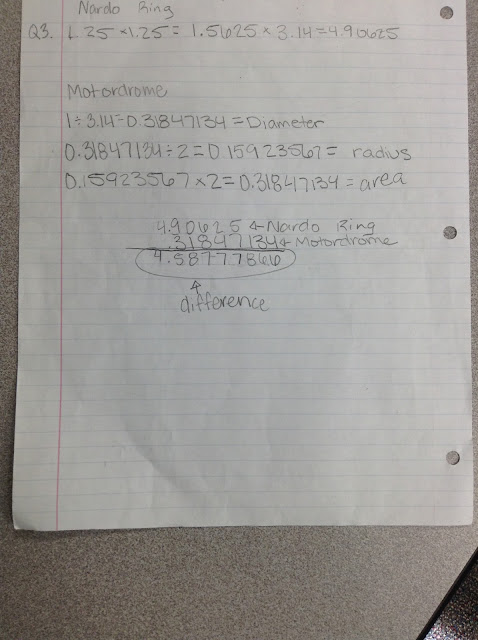
Here is what the students saw upon entering the classroom:
The Nardo Ring is a high speed test track in Italy. Use this link to Google Maps to get an idea of what it looks like...
Today, witness a race between my old high school car, the Chevy Celebrity, and the new Shelby Cobra Mustang (pic one and pic two). As you can tell from the pictures, my old ride will need a slight headstart to keep this race close.
Chevy Celebrity Speed - 40 mph (if it doesn’t fall apart first)
Shelby Cobra Speed - 90 mph
How to Use This Map:
The large orange dot is the Shelby Cobra, which is at the starting line and finish line. The large light blue dot is the Celebrity, which is where the head start is at. You can take the slider on the left hand side labeled r orange and move orange line to see the angle it makes with the starting line, or the green line (the angle measurement is also displayed on the right hand side).
Q1- Who wins the race? Use appropriate minutes and seconds to convey you answer.
Q2- At what degree does the Celebrity need to be placed at so the race is a tie (or as close to a tie as you can get)?
Q3- How much less space is contained inside the track at the old 1910 Los Angeles Motordrome than the Nardo Ring? The Motordrome is 1 mile around the track.
A few of the tougher spots for students on this task:
1. When finding the degree that the Celebrity should start at for the race to roughly be a tie, many students figure out how many degrees the car would take to get to 5 or so minutes to match the Cobra, but not where the car should start at on the track. It took a lot of conversation to understand that those numbers were not the same thing.
2. Finding the radius of the track that is 1 mile around was difficult because students had to use decimals without whole numbers to eventually get the circumference to be 1. I think if the track would have been 10 or so miles around, the radius would have been easier to find and made more sense, but there isn't anything wrong with using decimals. 8th graders should be able to do that.
3. Some students had to do a triple conversion of degrees being equal to miles being equal to minutes, which was different. Normally my students set up ratio tables for percentages and proportional relationships, but not normally in groups of three.
Some of the reasoning I really enjoyed from this task:
1. A few students also related the degrees of the track to fractional pieces of the track like 1/8th of the track or 1/16 of the track to help with conversions.
2. Students were all over the board on what information was used to solve the problem. For instance, you can find the time for both cars by only using the miles per hour, but some students ended up using miles per hour and degrees.
3. We were able to have a nice discussion on some of the variables that we did not factor into this race (like time taken to get to top speed for instance). These are valuable discussions that let students know that math isn't always as simple as it can sometimes be presented.
Enjoy the student work...especially the ones you can actually read without straining your eyes!
Dr. Clayton M. Edwards
Grundy Center Middle School
Middle School Mathematics Instructor
Curriculum Vita
-
National Council of Teachers of Mathematics Editorial Panel
Iowa Department of Education Statewide Mathematics Leadership Team
Journal of Educational Technology and Society Executive Peer Reviewer
-
Grundy Center Middle School
Middle School Mathematics Instructor
Curriculum Vita
-
National Council of Teachers of Mathematics Editorial Panel
Iowa Department of Education Statewide Mathematics Leadership Team
Journal of Educational Technology and Society Executive Peer Reviewer
-
Ed. D. Curriculum and Instruction (UNI)
MA Middle Level Mathematics (UNI)
Yager Exemplary Teaching Award 2014
BlogMA Middle Level Mathematics (UNI)
Yager Exemplary Teaching Award 2014


