Tuesday, May 9, 2017

Whiteboard Task

I don't claim to be a great creator of these mathematical tasks...in fact most of the tasks I use I adapt from the Internet. Every once in awhile I will come up with a situation that the students will enjoy or be excited about that I can parlay into a task, and in this case the situation came from difficult experience from the previous year for my students. I left for a year to teach at the collegiate level, which I enjoyed, but I decided to come back this year to the middle school. I was in my old classroom last year a lot, and I wanted to come in so much as a college professor to still have the credibility of having a connection with middle school students. I think my college students appreciated this and knew what I was telling them was relevant and not coming from someone who hadn't worked with a middle school student in 20 years. Anyway, my classroom was much different last year in philosophy by the person who replaced me. I am not sure if it was necessarily bad, just very different. I had noticed that many of my students got bored or something during class and would write middle school type phrases on the back of my whiteboards (if you watch intro video one, you will see my favorite...it's hard for me to even be mad because it was clever). These whiteboards were clean on the wooden backs the year before, and now the whiteboard backs were covered with writing. I wanted to get rid of this writing, because I wanted the students to see that this wasn't how we operated, so I decided to cover the backs with contact paper that doubled as a whiteboard. This wasn't cheap to do, so I decided to incorporate this covering of whiteboards into a task.

When the students were watching the videos for this task, I could see a lot of smiles on faces because these were the same students who had written on the backs of these boards the year before. This was a great chance for them to reflect on how much had changed in just a year's time.

Here is the task:


Info One: 20 Whiteboards needed to be covered…
Info Two (the price has changed since we did this task): Contact Paper Specs


Question One: How many rolls did I need to cover the boards?
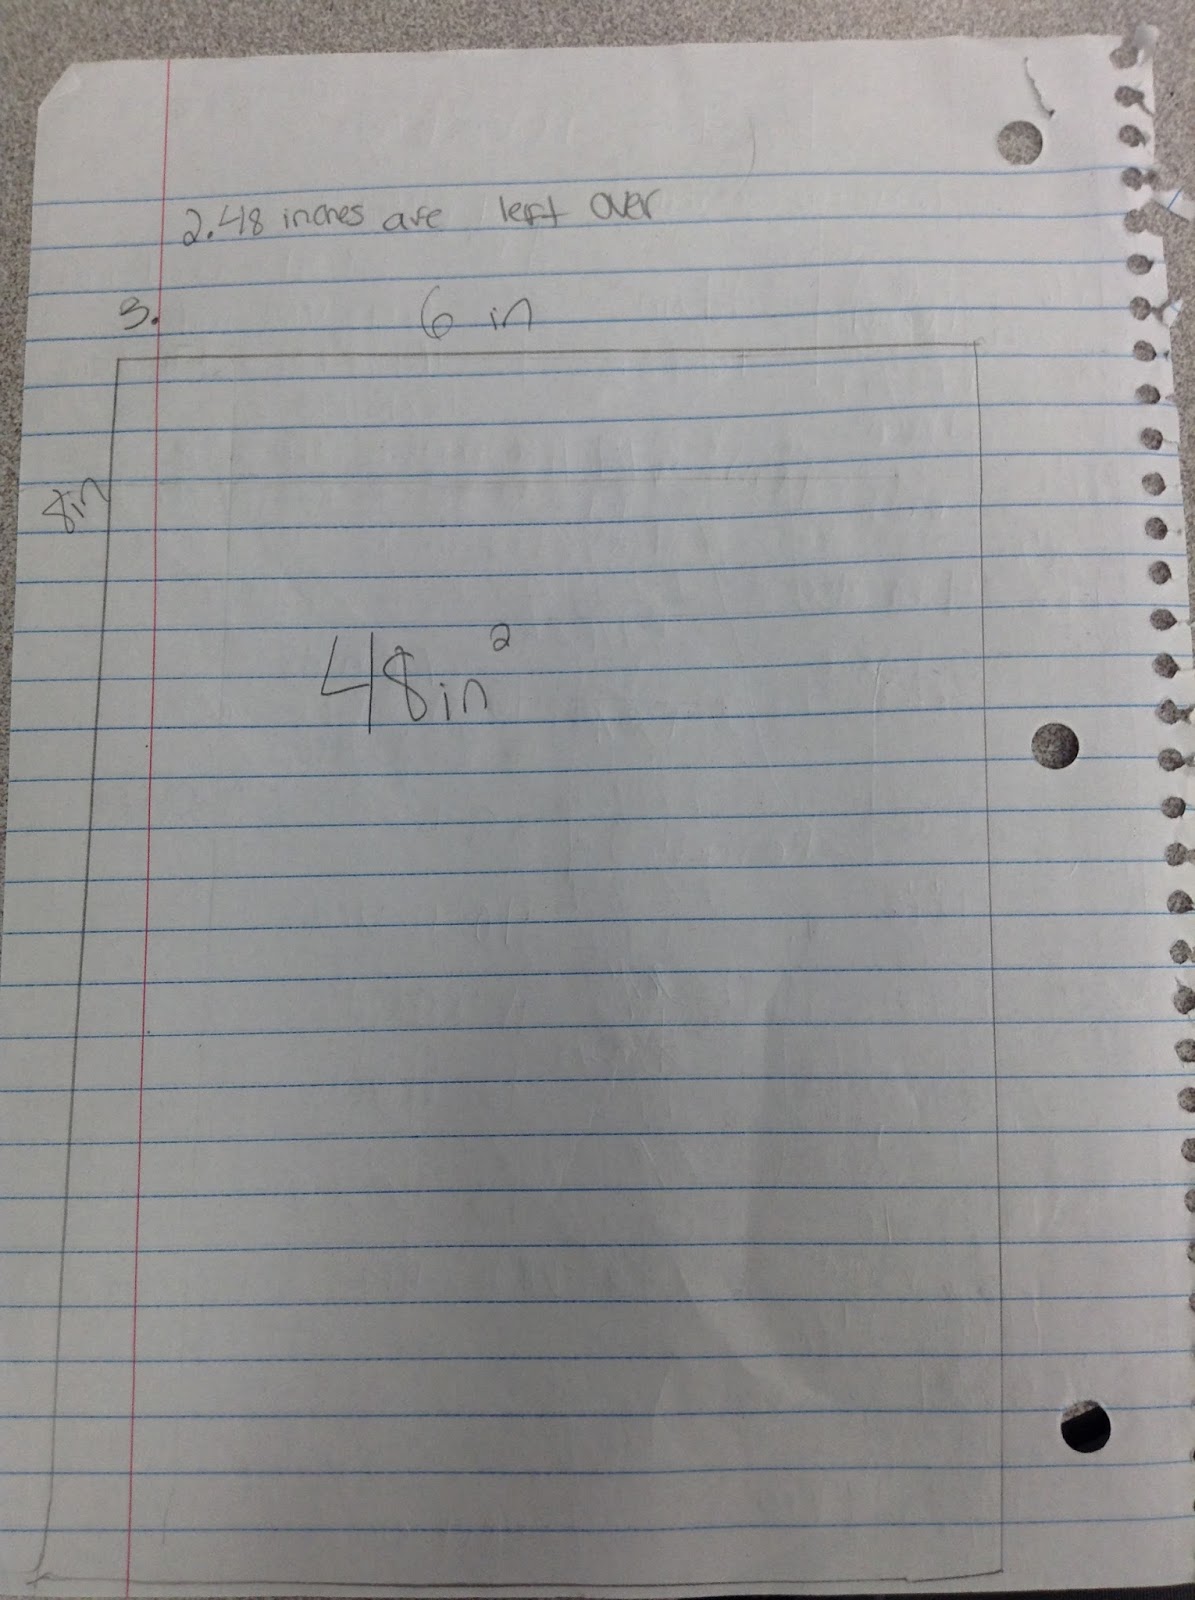
Question Two: How much contact paper was left over?
Question Three: Draw a real-sized rectangle that the remaining pieces could cover.
Question Four: How much did I spend on contact paper?
Question Five: If the store let me take back the extra contact paper, how much money would I get back assuming that the cost/amount received is proportional?

There were a different ways students approached this task. Some of the students found the total area of the boards and fit them into the rolls. This made everything a lot cleaner and easier, but not as interesting. A few students created an actual picture showing where the white boards fit onto the paper, and then showed how the scraps were utilized. Other students figured out how many boards could fit in one roll in a numerical value, and saved the leftover in number form until there was enough square inches to trade in for another board. Students are always amazed when discussing with other students and groups how different some of these methods are while having many similarities.

While I may not be the best task creator, this task checked many of the objectives I look for (not related to content). These objectives include multiple entry points, something interesting for the student to discuss both mathematically and situationally, and a situation the students would enjoy. Not bad for one of my first attempts creating from scratch! I have included a variety of student work below to give you an idea of what I expect. 


Tuesday, February 14, 2017

Nardo Ring

Today's task comes from Dane Ehlert and his page of 3-Act Tasks. I have been messing around with his Nardo Ring task since last year when I was at the University of Northern Iowa, and I finally got to implement my adaptive version with my 8th graders. This task was interesting for most students because they had never heard of this track (and neither had I). The ideas of fast cars, or in my case slow cars racing is exciting, and many students took a few minutes before getting started to do a little research on the track. Having tasks that are interesting for middle school students helps with engagement, which in turn makes the math content more meaningful. See exhibit A and exhibit B for more examples of tasks that middle school students enjoy. I also like the implementation of Desmos, even if it isn't a major part of the task. I use a lot of the Desmos Teacher activities, but I don't use Desmos for much more than that. I was happy to find some other uses.

Here is what the students saw upon entering the classroom:

The Nardo Ring is a high speed test track in Italy. Use this link to Google Maps to get an idea of what it looks like...


Today, witness a race between my old high school car, the Chevy Celebrity, and the new Shelby Cobra Mustang (pic one and pic two). As you can tell from the pictures, my old ride will need a slight headstart to keep this race close.

Chevy Celebrity Speed - 40 mph (if it doesn’t fall apart first)
Shelby Cobra Speed - 90 mph


How to Use This Map:
The large orange dot is the Shelby Cobra, which is at the starting line and finish line. The large light blue dot is the Celebrity, which is where the head start is at. You can take the slider on the left hand side labeled r orange and move orange line to see the angle it makes with the starting line, or the green line (the angle measurement is also displayed on the right hand side).

Q1- Who wins the race? Use appropriate minutes and seconds to convey you answer.

Q2- At what degree does the Celebrity need to be placed at so the race is a tie (or as close to a tie as you can get)?

Q3- How much less space is contained inside the track at the old 1910 Los Angeles Motordrome than the Nardo Ring? The Motordrome is 1 mile around the track.

A few of the tougher spots for students on this task:

1. When finding the degree that the Celebrity should start at for the race to roughly be a tie, many students figure out how many degrees the car would take to get to 5 or so minutes to match the Cobra, but not where the car should start at on the track. It took a lot of conversation to understand that those numbers were not the same thing.

2. Finding the radius of the track that is 1 mile around was difficult because students had to use decimals without whole numbers to eventually get the circumference to be 1. I think if the track would have been 10 or so miles around, the radius would have been easier to find and made more sense, but there isn't anything wrong with using decimals. 8th graders should be able to do that.

3. Some students had to do a triple conversion of degrees being equal to miles being equal to minutes, which was different. Normally my students set up ratio tables for percentages and proportional relationships, but not normally in groups of three.

Some of the reasoning I really enjoyed from this task:

1. A few students also related the degrees of the track to fractional pieces of the track like 1/8th of the track or 1/16 of the track to help with conversions.

2. Students were all over the board on what information was used to solve the problem. For instance, you can find the time for both cars by only using the miles per hour, but some students ended up using miles per hour and degrees.

3. We were able to have a nice discussion on some of the variables that we did not factor into this race (like time taken to get to top speed for instance). These are valuable discussions that let students know that math isn't always as simple as it can sometimes be presented.

Enjoy the student work...especially the ones you can actually read without straining your eyes! 


Ed. D. Curriculum and Instruction (UNI)
MA Middle Level Mathematics (UNI)
Yager Exemplary Teaching Award 2014
Blog

Saturday, January 28, 2017

Tug-Of-War Task

Following @mburnsmath on Twitter has paid off. This time the payment was an older task of hers, A Mathematical Tug-of-War. I did this task with my 7th graders, and while this may not have been the most difficult task I have ever presented, it may be the most accessible. When discussing this task during class with individual students and groups, I counted four distinctive approaches, with different variations of those four approaches present. I would categorize different ways as informal substitution, Algebra/combining like terms, unit rates, and assigning values (some of these overlap between the student work). I have examples of each posted at the end of the post.

Q1
Screen Shot 2017-01-16 at 7.31.20 AM.png
Can be found in 50 Problem Solving Lessons for Grades 1-6 Marilyn Burns Math Solutions Press 2003

Q2 What character(s) could you add to the losing side of round three to make the round a draw?

Q3 Dr. Edwards is teaming up with Ivan to form a tug-of-war dream team. Dr. Edwards is twice as strong as Ivan. You are forming your own team to tie Dr. Edwards and Ivan’s team. Give TWO possible team formations of Grandmas and/or Acrobats to TIE Dr. Edwards and Ivan’s team.

This is also a great example of a task that isn't necessarily real-world, but it is interesting for the students. Not everything has to be real-world all the time. The important thing is that the students are discussing the math involved. Maybe some will argue with me that this is real-world...I have seen a lot of wacky things on ESPN 2 late at night, but never the International Tug-Of-War Competition where animals and people are allowed to enter, although that would be interesting television. Same goes for this task...

A few of my students struggled to get started and were hung up on both sides needing to have an equal number of people in physical number and not in amount of strength. I gave the example of myself having a tug-of-war match with one of my student's kindergarten sisters. There would be one person on each side, but it wouldn't necessarily be equal. That worked well.

This task is also a good way to organically get away from a problem being on one side of the equals sign and one number being on the other side. The equal side doesn't necessarily mean question and answer like many students come to me thinking, but both sides being the same amount. When I previously taught 6th grade, problems like 3 + 5 - 2 = 1 + 1 + x would be difficult, and I think this task would help solidify what the equals sign really means.

I was disappointed that some of my students called me out on being as strong as two Ivan's, but in rethinking the reality of the situation, it probably depends on what four grandmas and what two acrobats I would be facing!


(The 100% reference loses its meaning after the first round, and we discussed that after this was submitted)

Other Task Posts Examples (more available in previous entries)...

Pokemon Go

Man Versus Squirrel

Shrinking Dollar

Tuesday, January 10, 2017

Toothpick Task 2017

I had an icy two-hour delay this morning, and when you operate off the a combination of getting to school by 6 every morning and living 40 minutes away from school, I never find out about the delay until after I arrive. I enjoy these mornings because I get to catch up on some work. I had a few students come in 3 hours before school started to work, I submitted a manuscript review for Mathematics Teaching in the Middle School, and worked on questions for an upcoming MTMS Twitter chat (which you should join the 3rd Wednesday of each month at 9ET/8CT with using #MTMSchat).

To the task...

Additional Information 

Q1~How many complete rows of toothpicks can you make with the amount given?
Q2~Will there be any extra? How many?
Q3~How many more would you need to complete the next full row?
Q4~How many toothpicks would the container need to create 20 rows?
Q5~If someone wanted to know how many toothpicks would be in the 75th row and you didn’t want to build that big of a pyramid, what could you do to find that answer fast? How do you know that will work?

The first part of this toothpick task (by @ddmeyer http://bit.ly/2jzv0sZ) begins innocently enough, with students trying to find out how many full rows could be made with the given amount of toothpicks. The interesting part to this is how students choose to solve this first problem. Almost all of the students (I did this with 7th grade, but could work for 5-8 or more). will start by dividing 250 by 3, not fully thinking what the result will mean. Once it is understood what this answer of 83ish means (asking a quick question about what does the 3 mean normally brings light to this problem), students branched off into three different ways to solve: a full blown picture, a chart, or a combination. Within these three options, most students either went with the tooth pick totals, or the total number of triangles. While many of these options will be similar, the different number of ways to solve this problem speaks to the accessibility of this task.

Question 5 is a great question as well because you can get into some generalizing. Some students automatically search for patterns, but some don't think of that as an option. Making it more explicit helps students understand that finding patterns is an option that can always be looked for. Patterns may not always be prevalent, but at least now students know that option exists.

This task will help us move into some tasks with some equation/expression writing built in such as Central Park, In-N-Out Burger, and Detention Buy-Out.

Enjoy the student work below! I especially like the one towards the middle where the students exclusively used triangles instead of individual toothpicks like many of the students used.

Note: As I was typing this, we are now cancelled :-(


Other Task Posts Examples (more available in previous entries)...

Pokemon Go

Man Versus Squirrel

Shrinking Dollar

Friday, December 2, 2016

Sticky Note Task Expanded

With my 7th graders, we recently finished the sticky note task, which is a compilation of tasks by Andrew Stadel and Jon Orr. I have done this in the past, but added the part by Jon this year. Surface area is probably the predominant math concept, but I found question 4 to be particularly interesting. Before we talk about that, here is the task...


Q1: How many sticky notes are needed to cover every exposed face of the cabinet?

Q2: How many pads would you need to have enough sticky notes?


Q3: How many sticky notes fit on the whiteboard?

Q4: If you had 120 of the 1.5 inch by 2 inch sticky notes, what is one size of board that you could cover (dimensions and area)?


Q5: What fraction and percent represents the following categories?
*Pink and blue Combined?
*All colors that are not pink or blue?


For question 4, students had a variety of amounts of sticky notes on the boards...anywhere from 12 notes by 10 notes to more of a ribbon board look of 120 notes by 1 note or 60 notes by 2 notes. The unexpected part for the students came when figuring out how much space the board they created took up. No matter the configuration of the 120 stick notes, the area of the board was always 360 square inches. This makes sense since all of the boards have the same number of sticky notes, and each note has an individual area of 3, but this took some time for everyone to comprehend. A great discussion piece for sure. 

The other thing I think was interesting about this task was if the students chose to find the sticky notes by finding the area of the board/face of the cabinet first, or find the number of sticky notes along the length and the width first. Some student did one method for question 1 and the other for question 3. 

This was a great task that would be appropriate for almost all levels of middle school. I have included some student work below. 

_


 _


_


_


_


 _